It’s strange to be talking about Linux stuff on a reef site, but then again…
I spent the better part of the weekend setting up an ELK stack on my web server. I’ve never been happy with the silly graphs my reeflog was producing. Mostly the fact that they were not dynamic at all, which made it very painful if I wanted to see something that was already graphed.
I already have all the data going to a MySQL, and I’ve been searching for a better way of graphing that data.
Thus enters Grafana. Grafana is an application that runs on the web server and can be used to alert, show and graph various timedate based data. Unfortunately it does not have hooks for getting data directly from a MySQL database.
So, you install ElasticSearch. ElasticSearch is basically a nodb logging database that can take in data from endpoints and store it in an easily searchable fashion… But how do I get the data from the MySQL DB into the ElasticSearch.
Next you install logstash. Logstash is yet another service that runs. You can configure various inputs and provide it various outputs and it will transpose the data from one source to the other. In my case, it logs in to the MySQL DB, grabs any data since the last update, and puts it into ElasticSearch.
Probably the biggest thing I’ve learned since doing this is that the Wifi connection to the internet is spotty at best for my poor little Raspberry Pi. There’s quite a few times where it doesn’t get data up to the server. It doesn’t really matter… most things don’t happen quite that quickly in a reef tank. The one thing I probably miss out on is anytime the top-off pump runs as it typically only runs for a minute to begin with.
If I setup a kalk reactor like I want to, then I may switch out the pump with a doser. That would run slower than a top-off pump would and may get caught be the graph more often.
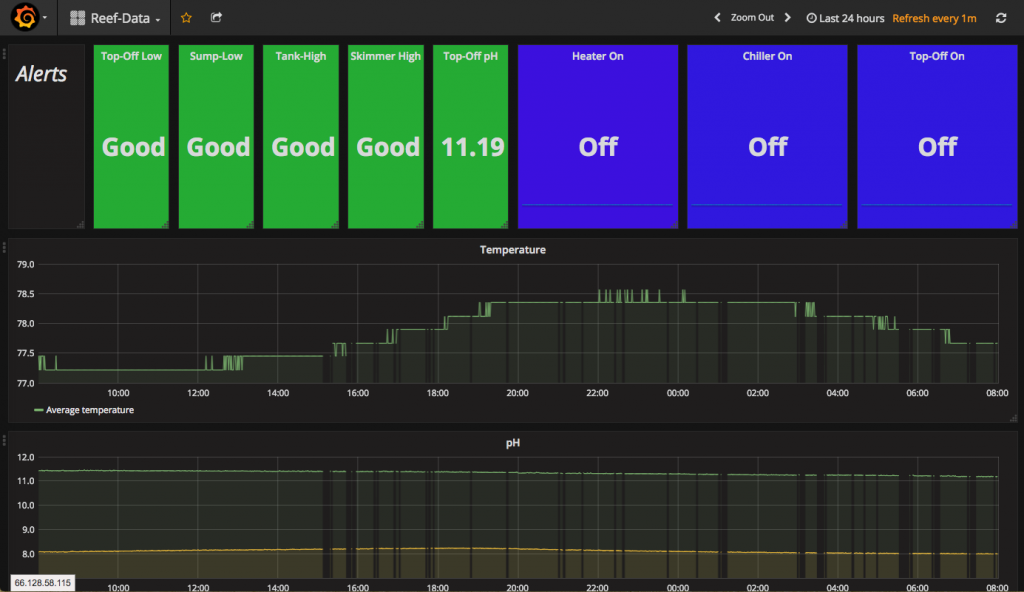
Here’s a screenshot of the current dashboard. Alerts are at the top. pH and Temperature are graphed at the bottom.